

Eastwind analyzed anonymized data from a CIS bank and developed an ML model that identifies customers likely to churn several months before their actual departure. The model analyzes financial activity, transactions, communications, and behavioral patterns to detect early indicators of churn.
As a result of the pilot project, the bank identified 70% of customers who later stopped using its services and confirmed that big data analytics can serve as a tool for increasing LTV.
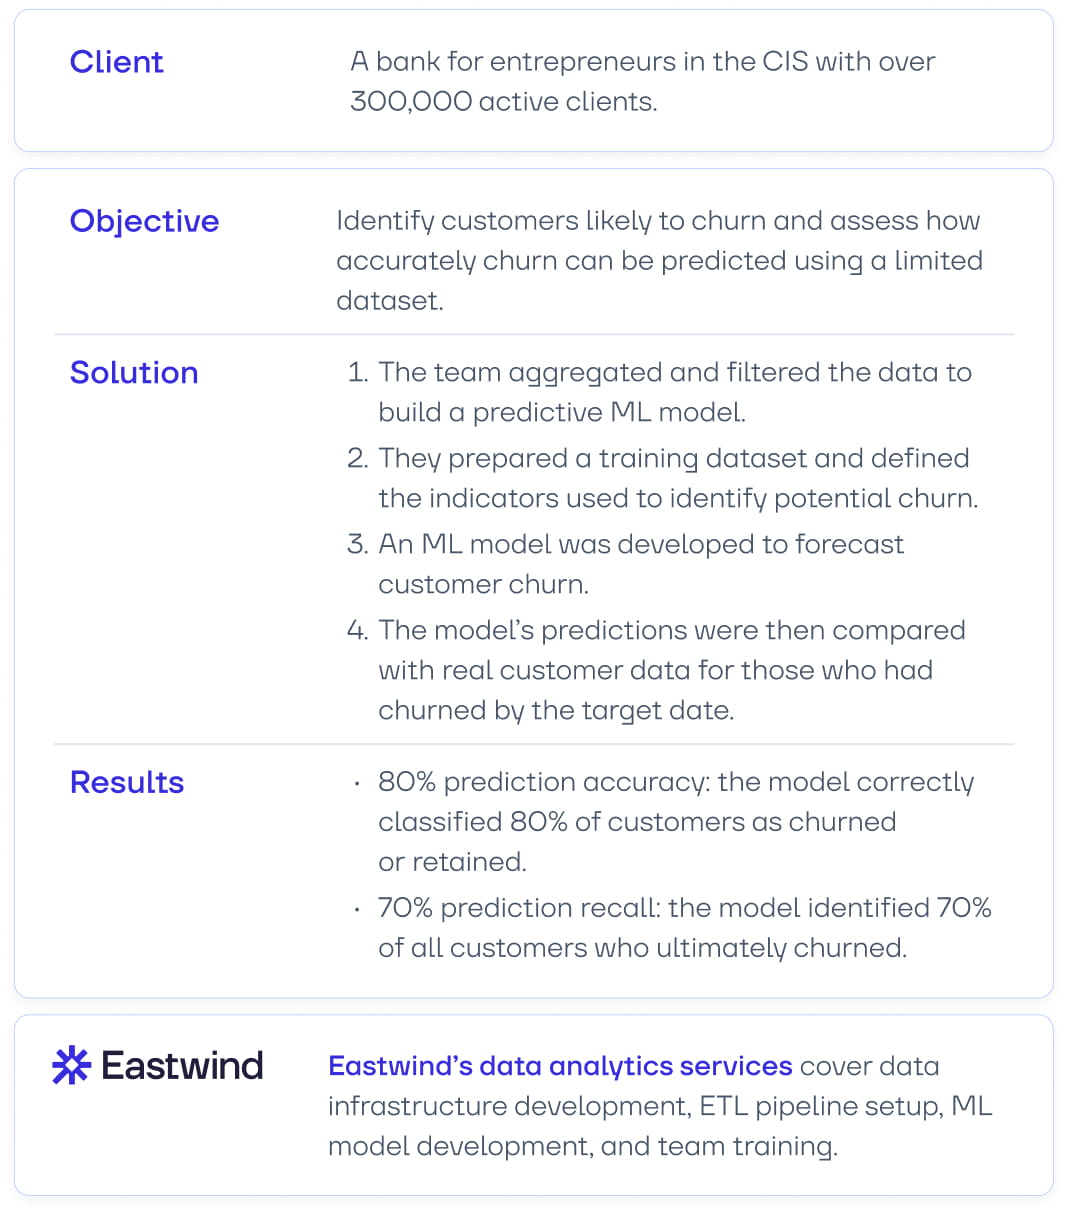
Objective: Detect Churn and Assess the Effectiveness of Predictive Analytics
A bank with a customer base of hundreds of thousands wanted to evaluate how accurately customer churn could be predicted using its existing data.
The Eastwind team focused on several objectives:
- identifying behavioral patterns that signal a potential customer departure;
- developing an ML model to forecast churn;
- validating the model on the bank’s historical data and comparing predictions with real outcomes;
- evaluating how these insights could support the bank’s customer retention strategies.
A key goal of the pilot project was to determine how early churn signals could be detected, giving the bank enough time to take proactive retention measures.
Working with the bank’s specialists, we found that analyzing customer behavior five months before the actual departure is the most effective approach. At this stage, the decision to switch banks is already taking shape but can still be influenced through targeted retention campaigns.
Solution: From Data Preparation to Model Training
The churn prediction pilot project progressed through several stages, from defining the problem and preparing the data to training the ML model and validating the accuracy of the predictions. This approach enabled the team to test the value of analytics on a limited data set and evaluate the potential for scaling the solution.
Defining the Types of Churn to Predict
At the initial stage, Eastwind specialists worked with the bank’s team to determine which cases should be classified as churn. The bank identified three types of customer departure:
- intentional churn: when a customer chooses to switch to a competitor;
- rotational churn: when a customer stops using the bank’s services due to external circumstances, such as relocation;
- forced churn: when the bank terminates its agreement with the customer.
Together with the bank’s specialists, we defined churn as only the first two categories. Forced churn was excluded because it is driven by the bank’s internal processes and does not reflect customer behavior.
Another key step was identifying the time window when the customer’s decision could still be influenced. The analysis showed that about two months before leaving, customers are already certain about their decision, making retention extremely difficult. As a result, the model was trained on data covering the five months leading up to the actual churn.
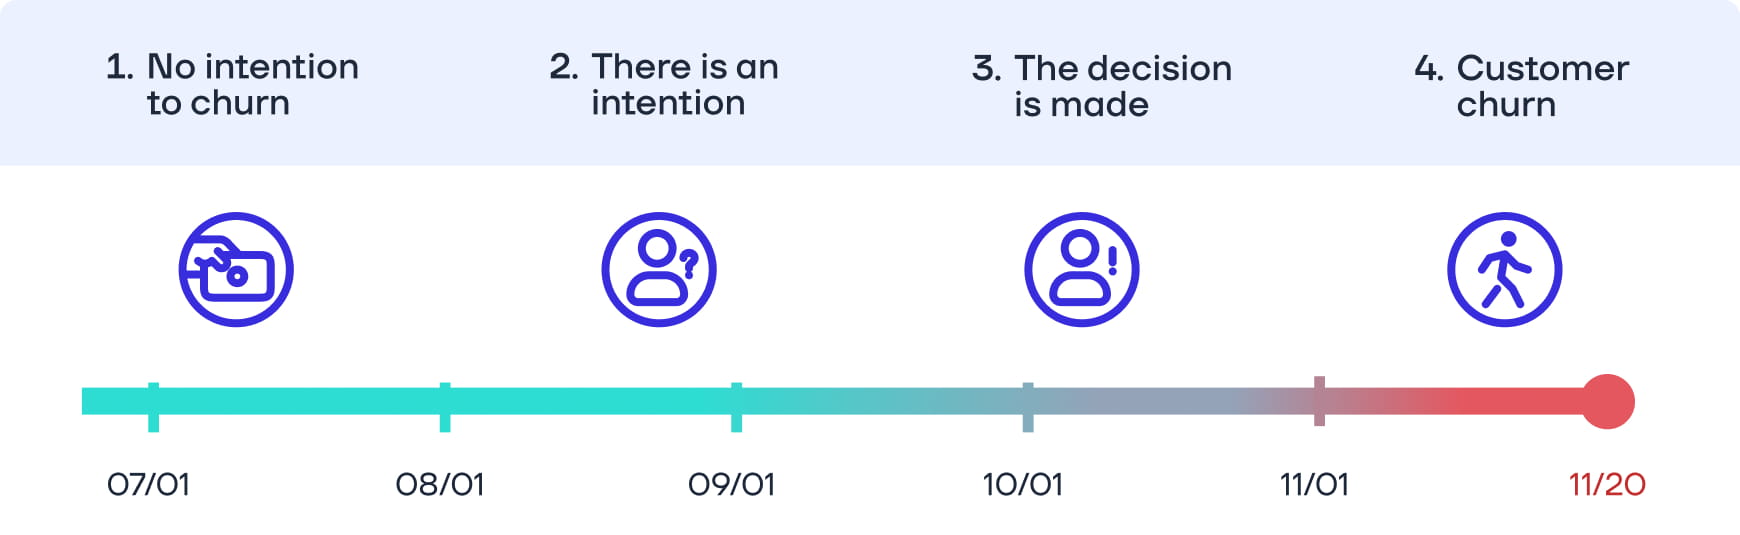
Customer churn lifecycle: from early warning signs to the customer’s actual departure
Preparing and Anonymizing Customer Data
Once the churn criteria were defined, the bank exported nine months of customer data. All data was anonymized and encrypted in advance to prevent any disclosure of personal information.
The bank provided the data in text files, and Eastwind specialists then prepared it for analysis:
- converted the files into a unified format;
- structured the information;
- cleaned the data by removing technical errors;
- created structured tables for further modeling.
As a result, we compiled an anonymized history of customer activity, including:
- basic customer information;
- details about accounts and contracts;
- tariffs and product parameters;
- account balances and daily cash flows;
- transfers within the bank and to external counterparties;
- bank card transactions;
- communications between the bank and the customer;
- requests to close accounts.
Together, these data points provided a comprehensive view of customers’ financial behavior.
Filtering the Data and Building the Training Dataset
At the next stage, Eastwind specialists filtered the data to improve the quality of the analysis. The team excluded:
- customers the bank did not intend to retain;
- users with less than 30 days of transaction history;
- records with incomplete or incorrect data.
After cleaning the data, the team built a training dataset that included customers who had already churned as well as those who remained with the bank.
Analysts then visualized each customer’s activity history and compared the behavioral patterns of users who stayed with the bank and those who later churned.
Identifying Key Behavioral Indicators of Churn
The analysis showed that customers who are planning to leave the bank gradually change their financial activity patterns.
Transaction activity declines. The number of transactions steadily decreases. Many customers who later churn stop making debit transactions for extended periods and show only minimal incoming transactions.
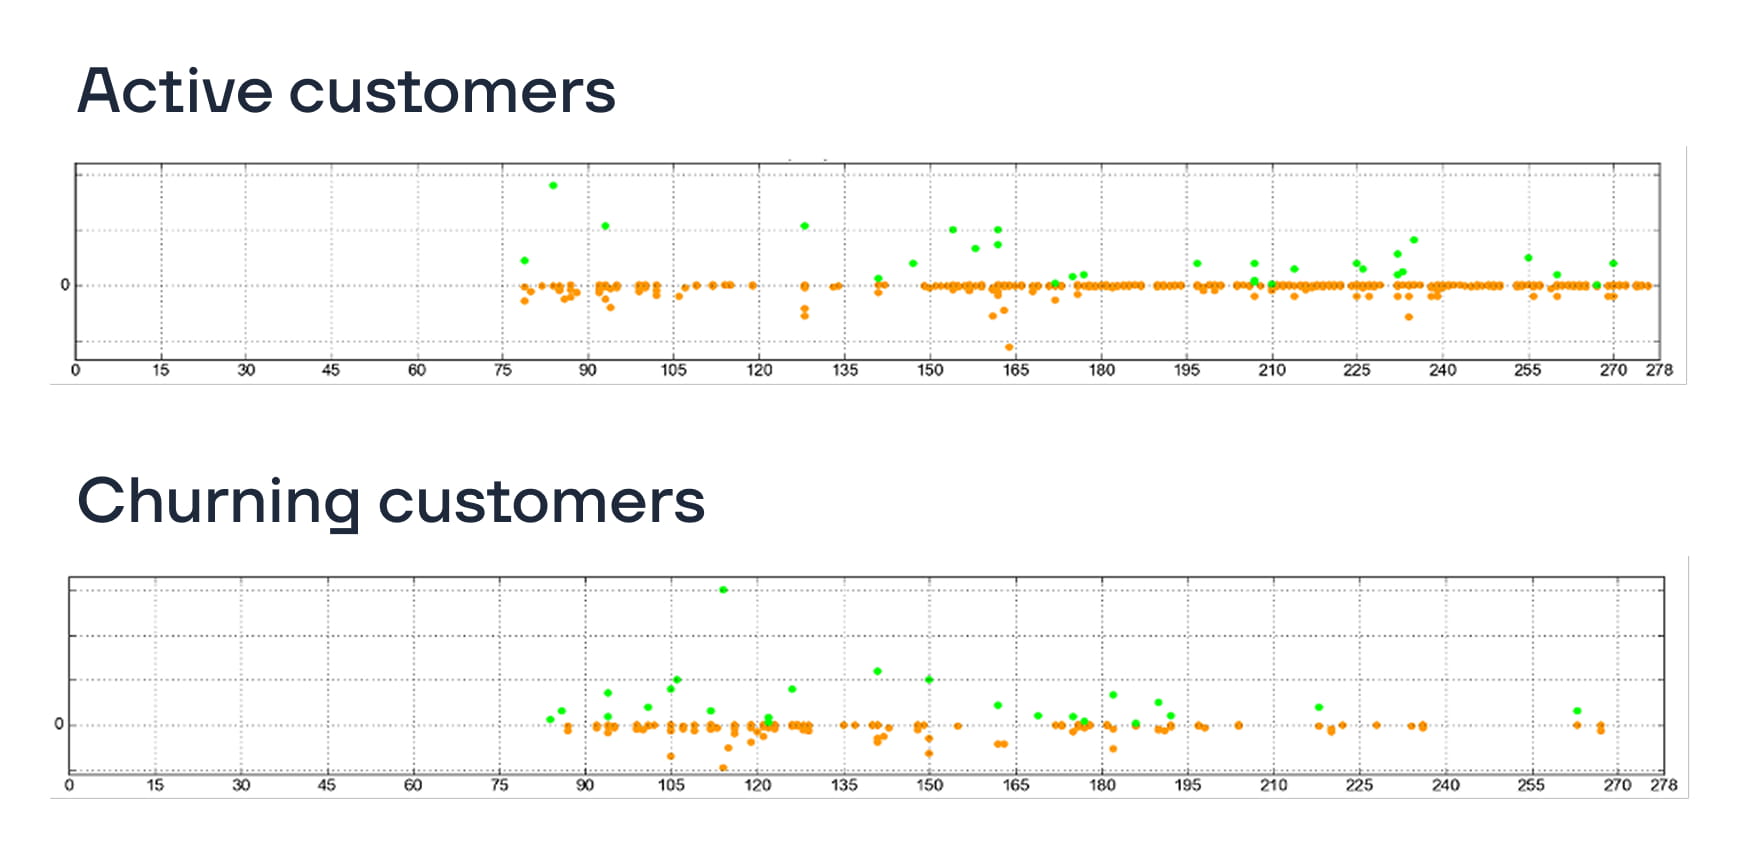
Green dots show credit transactions, while orange dots show debit transactions
Overall activity drops. Customers who actively use banking products tend to maintain stable transaction activity. In contrast, customers likely to churn show a gradual decline in activity until it nearly reaches zero.
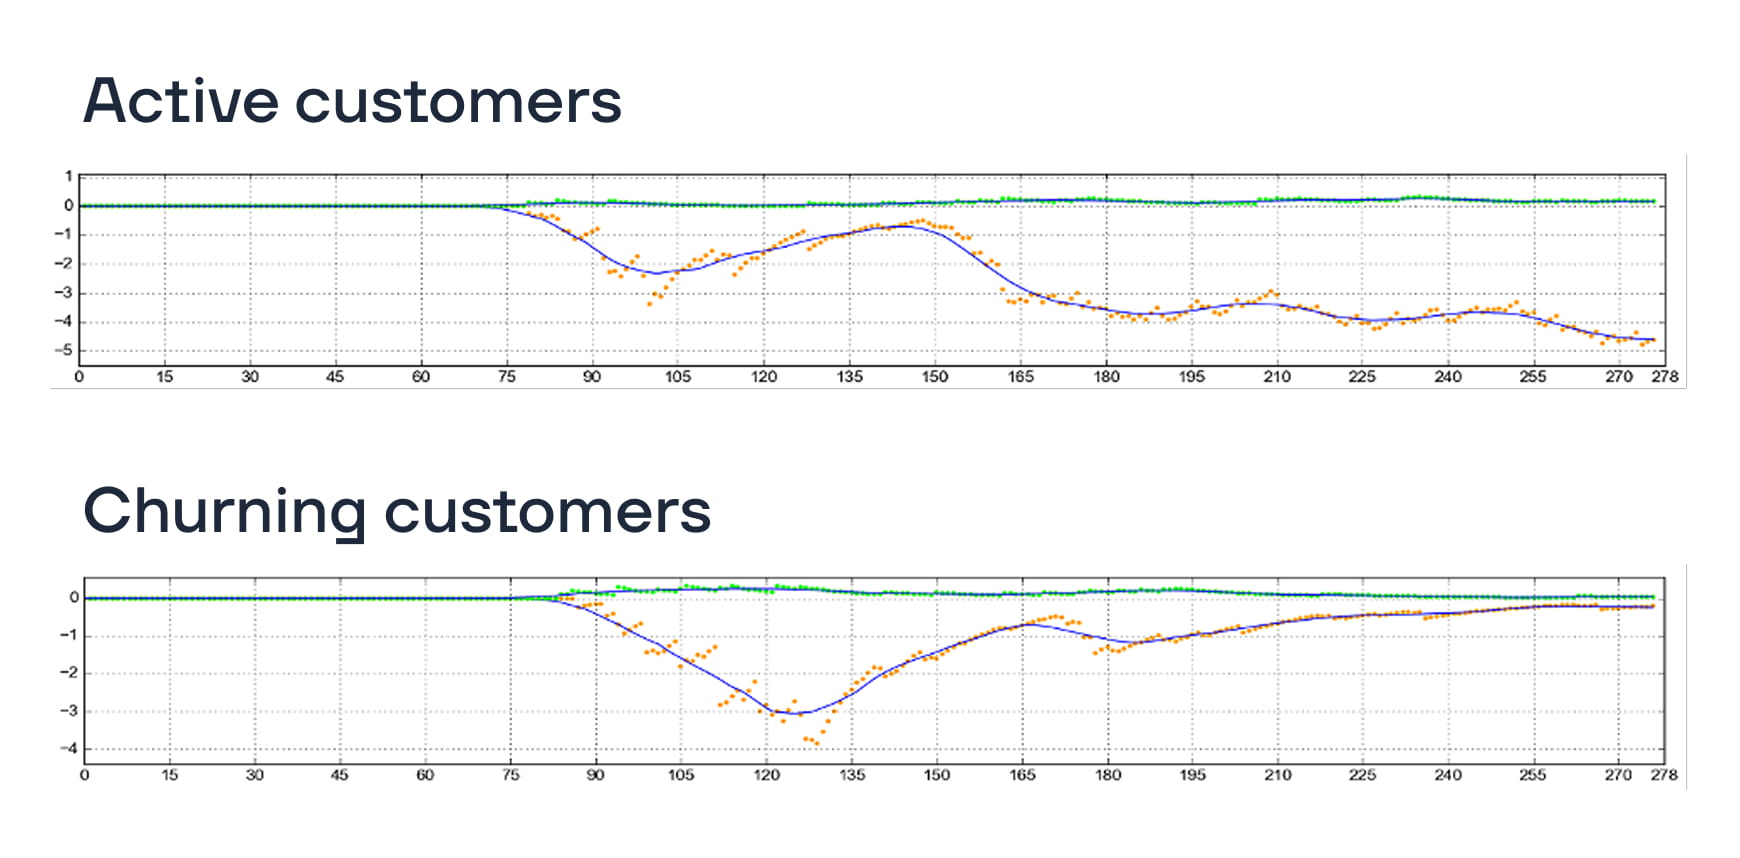
For customers planning to leave the bank, activity levels gradually drop to nearly zero
Account top ups decline. Another key indicator is infrequent or minimal balance replenishments. In the period leading up to churn, customers almost completely stop adding funds to their accounts.
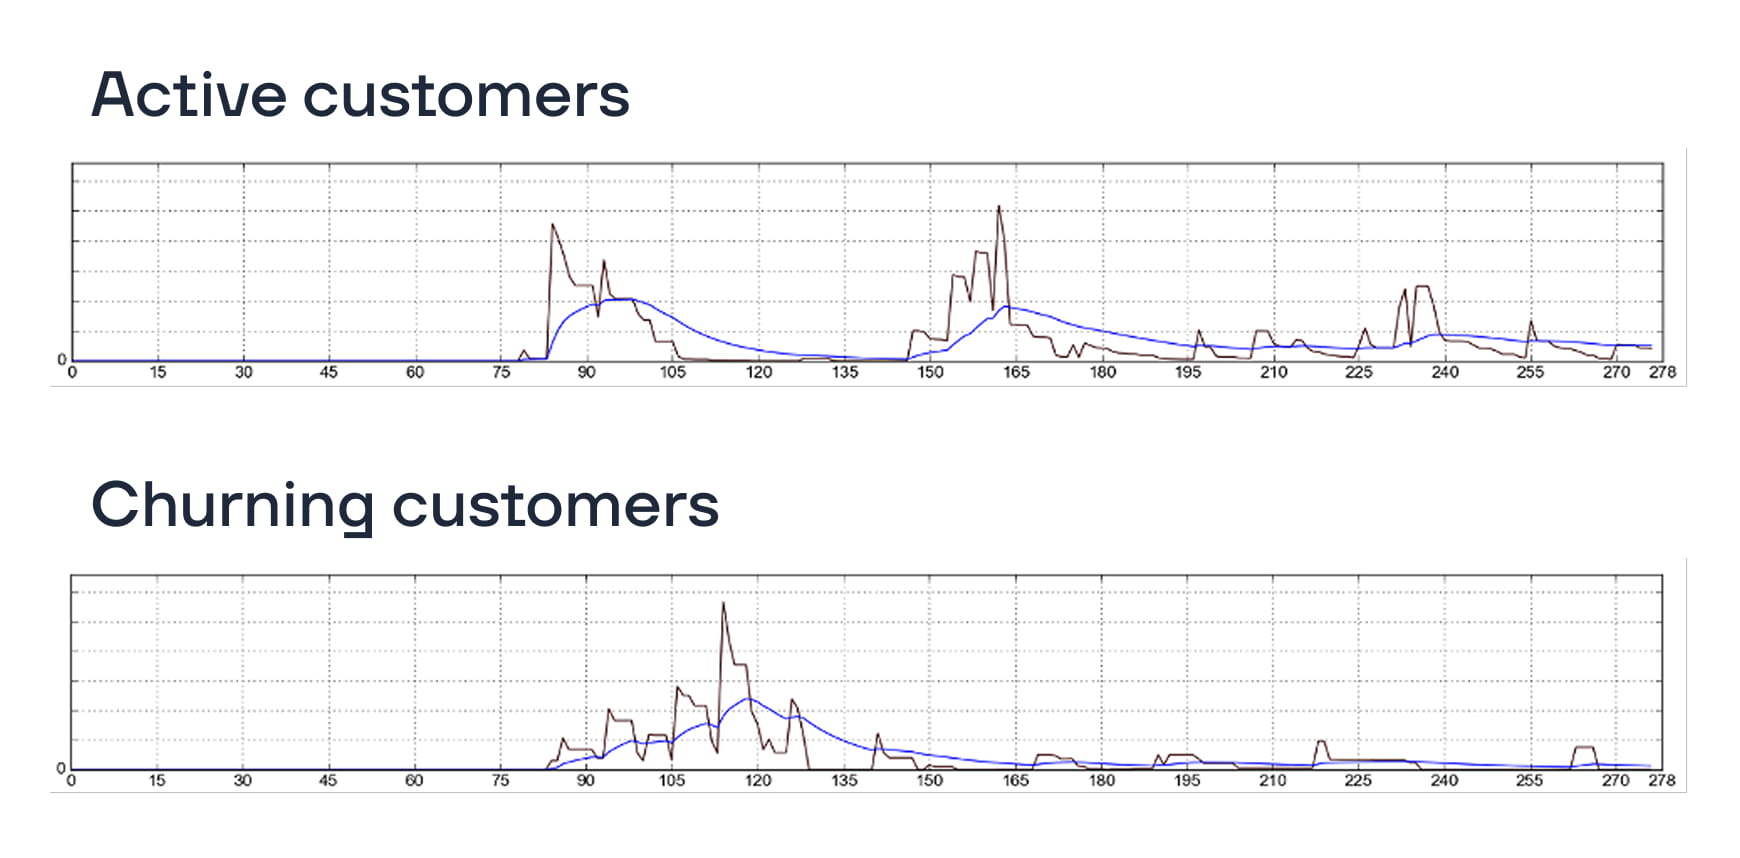
The black line shows the balance values, while the blue line represents a smoothed trend of the black line
Analyzing Social Graphs
In addition to analyzing individual activity, Eastwind analysts examined interactions between customers. To do this, they built transaction graphs showing which counterparties customers interact with most frequently.
This analysis revealed an additional indicator of potential churn: when a customer has almost no transactions with other customers of the same bank but actively transfers funds to other financial institutions, the likelihood of churn increases significantly.
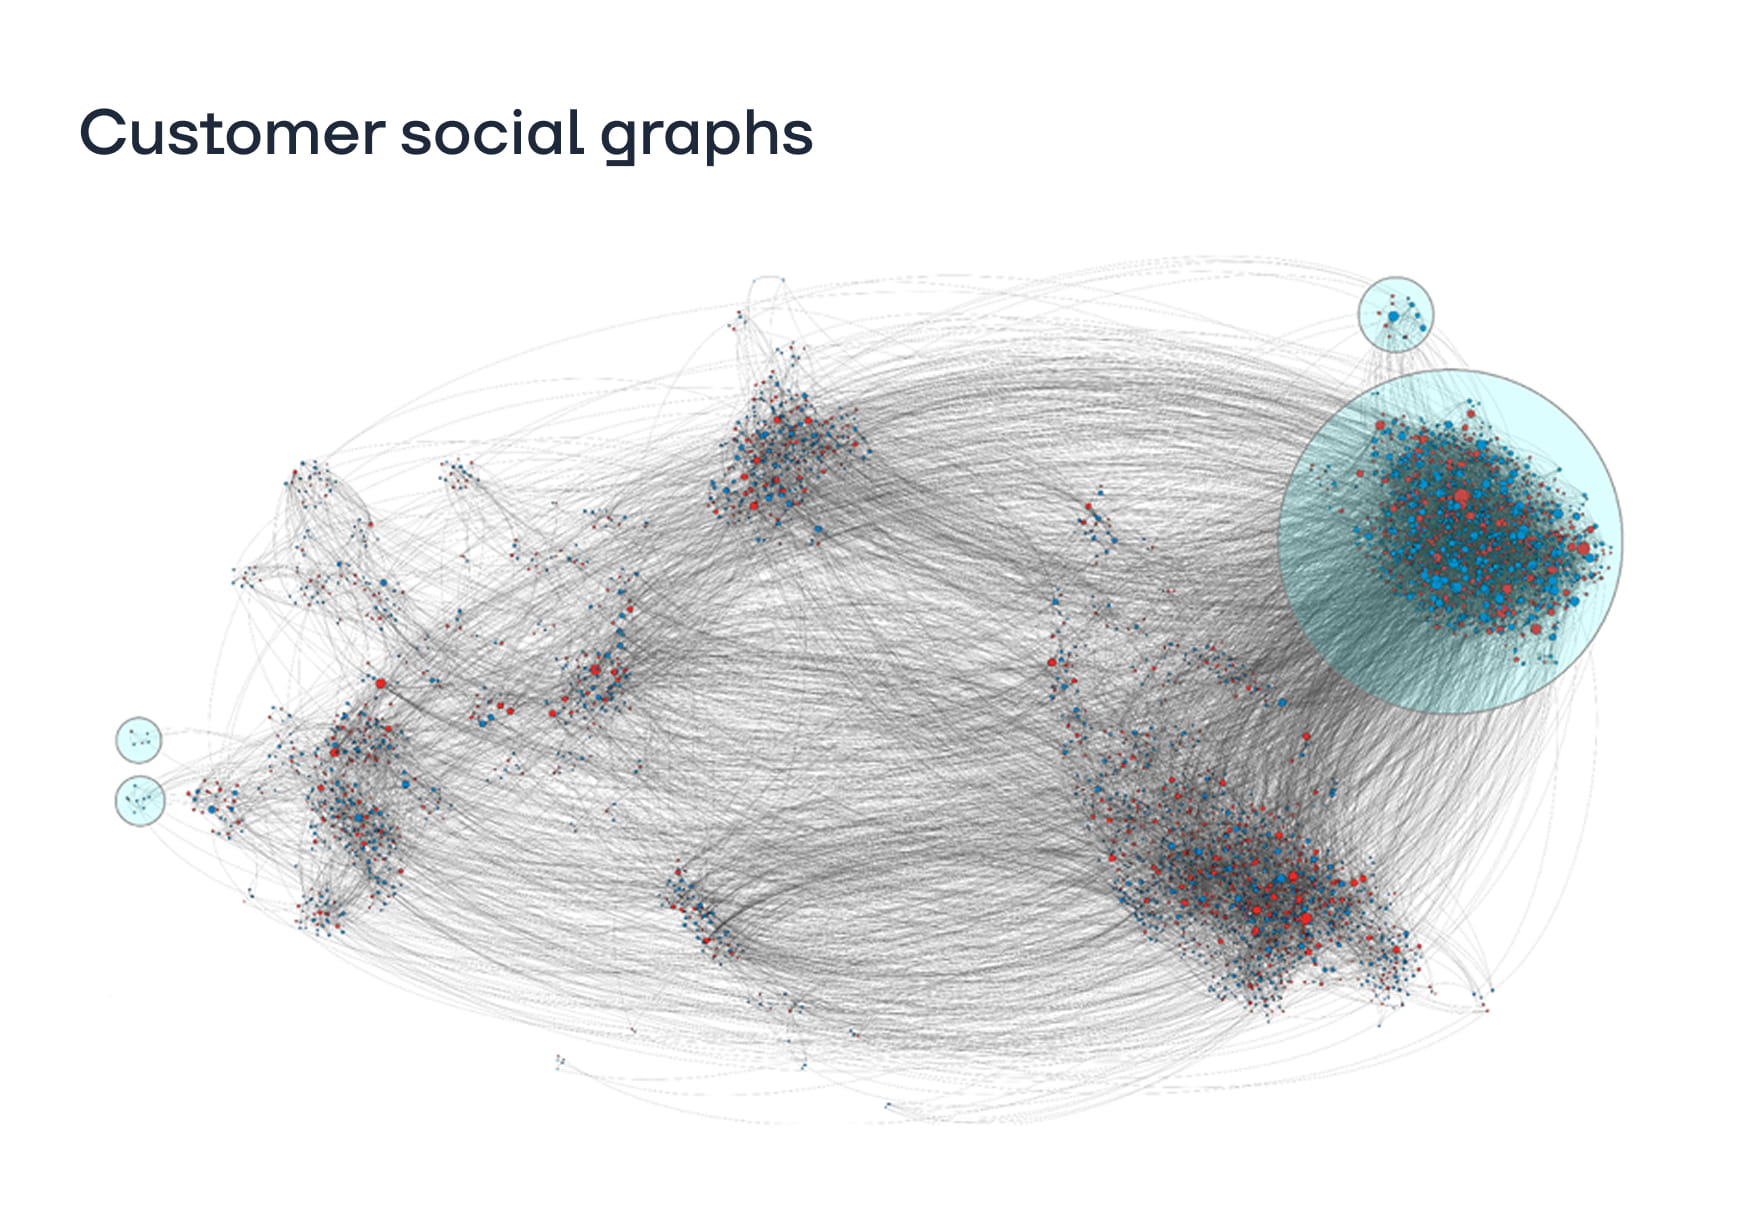
Blue dots represent the bank’s customers, while red dots represent customers of competing banks. Lines between them show the transactions connecting these clients
The bank particularly appreciated the idea of visualizing customer interactions. Traditional formats often lack sufficient clarity, making it difficult to notice obvious patterns. To demonstrate the results, Eastwind specialists developed a small application that allows users to visualize a customer’s interactions and transaction connections using a contract identifier.
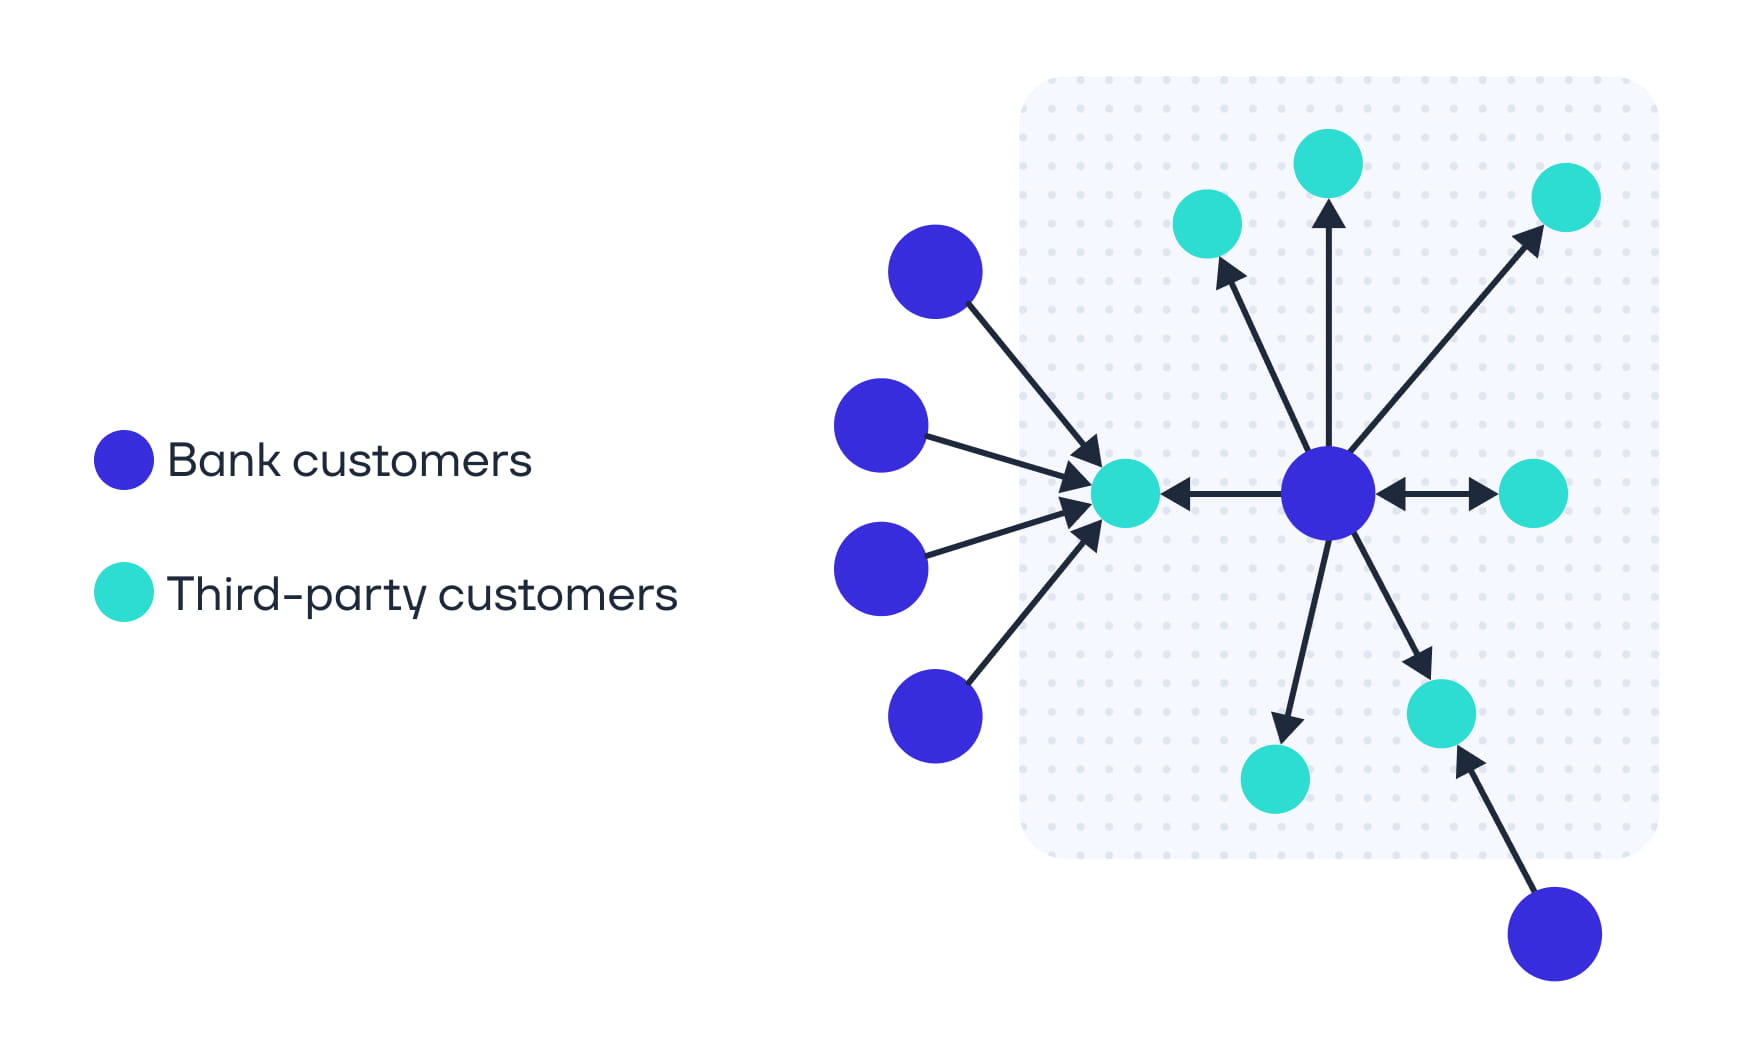
The customer only interacts with another bank’s counterparties. Such customers are most likely to churn from the bank
Training an ML Model to Predict Churn
After preparing the data, the Eastwind team developed a machine learning algorithm that analyzes customer behavior and identifies patterns typical of customers who are likely to churn.
The model was trained on a labeled dataset that showed:
- which customers remained with the bank
- which customers stopped using its services
The algorithm analyzed dozens of features including financial activity, transaction dynamics, and transaction structure to identify behavioral patterns associated with future churn. After training, the model was applied to the entire customer base to detect users whose behavior matched these patterns. As a result, the system produced a forecast identifying customers who were highly likely to leave the bank in the coming months.
Result: 80% Precision and 70% Recall
The predictive model was evaluated retrospectively. After completing the analysis, Eastwind specialists requested data from the bank on customers who had actually stopped using its services by the target date and compared these results with the ML model’s predictions.
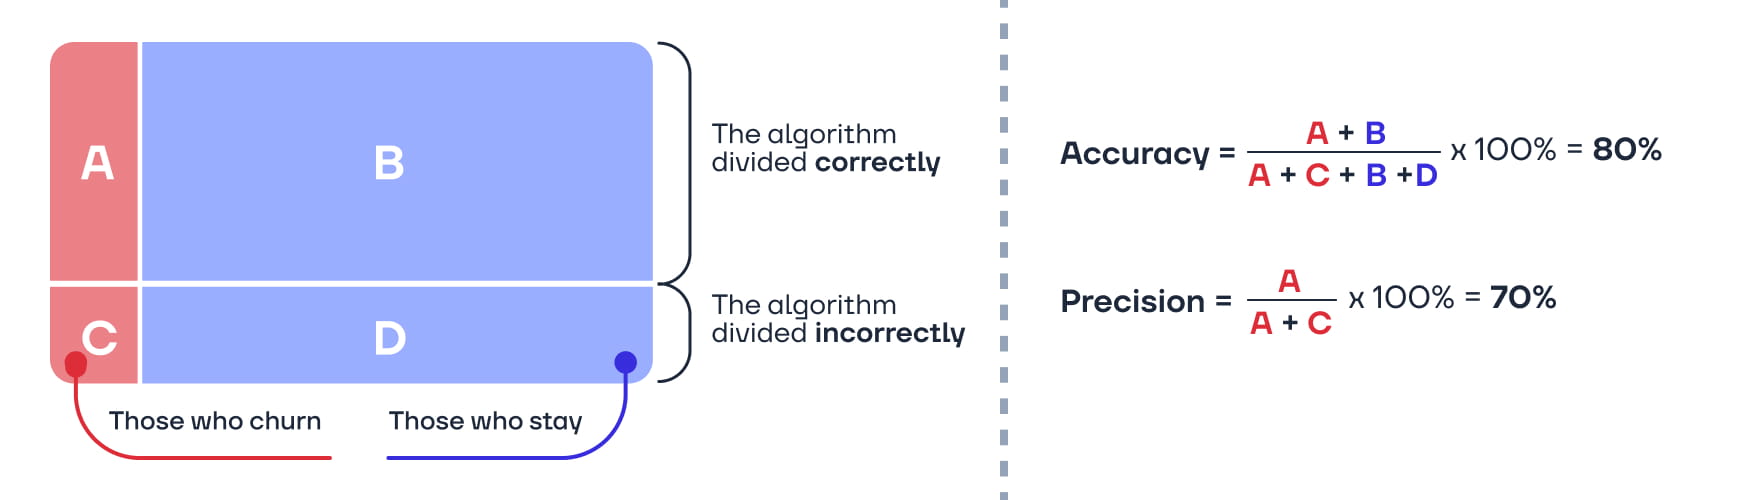
The comparison showed that the model successfully identified 70% of the customers who later left the bank. This result confirmed that behavioral data analysis can reveal churn signals long before the customer makes the final decision to leave.
“The model can become even more accurate if we analyze a larger volume of data. For example, insights into customer activity in online banking would be valuable. If we also know the sentiment of customer inquiries, the speed of request processing, and the results of surveys from customers who have left, we will be able to determine not only the fact of churn but also its underlying causes.”
Andrey Plyushchenko, Head of Data Analysis Group, Eastwind
The pilot project demonstrated that the bank can use big data analytics to manage its customer base more effectively. Early detection of customers likely to churn makes it possible to launch personalized offers and retention campaigns before the customer completely stops using the bank’s products.
The client was satisfied with the results and purchased the ML model for further scaling. The bank plans to use churn predictions to develop personalized communications and generate offers based on the Next Best Offer (NBO) principle.
Discover how data analytics can support your business. Book a free consultation on Eastwind data services.